Democratic strategists are enthusiastically examining the 2017 Virginia election results, looking for useful clues to guide their efforts in 2018. Despite the pre-election media coverage that focused heavily on the gubernatorial contest, the state legislative contests were the real story of the election. Democrats mounted a surprisingly strong effort to retake the House of Delegates. The results up and down the ballot showcase the Democratic Party’s further consolidation of their advantage in the state, with elevated vote shares even outside their base in the Northern Virginia suburbs. While a number of factors likely contributed to the enhanced performance, educational attainment stands out as a key metric and potential influence on voter preference. Ralph Northam’s 9.0-point victory combined with the surprising results in the House of Delegates could be a sign of things to come that should impact future targeting.
Exceeding Expectations
Despite late polls which incorrectly suggested that Ed Gillespie was closing the gap, the Democrats were always favored to retain the governorship. In fact, Northam’s 54.5 percent of the major-party vote outpaced all top-ticket Democrats—in both federal and state elections—dating back to 2008. The results in the House of Delegates were even more profound. As the election approached, most observers expected a Democratic gain of five to eight seats. However, the aforementioned late polls made that modest projection seem optimistic.
Notwithstanding recent competitive statewide elections, Virginia Republicans held a sizable pre-election majority in the House of Delegates (66-34)—thanks largely to the Republican gerrymander enacted by former Governor Bob McDonnell in 2011. In 2016, Hillary Clinton carried 51 of 100 districts, perhaps foreshadowing the outcome this year. Clinton won the state in 2016 by a commanding 5.6 points—dominating Northern Virginia and carrying the DC exurbs and all of the major cities in central and southern Virginia.
Comparatively, Governor McAuliffe won only 44 of 100 districts in the 2013 governor’s race, amassing a narrower 2.8-point statewide advantage. As the election approached, NCEC’s Democratic Performance Index (DPI) revealed that 47 of the 100 districts scored 50 percent or higher, with six additional seats falling in the 49 to 50 percent range. Given these DPI scores it could be argued that the results in the House of Delegates are less surprising than previously thought.
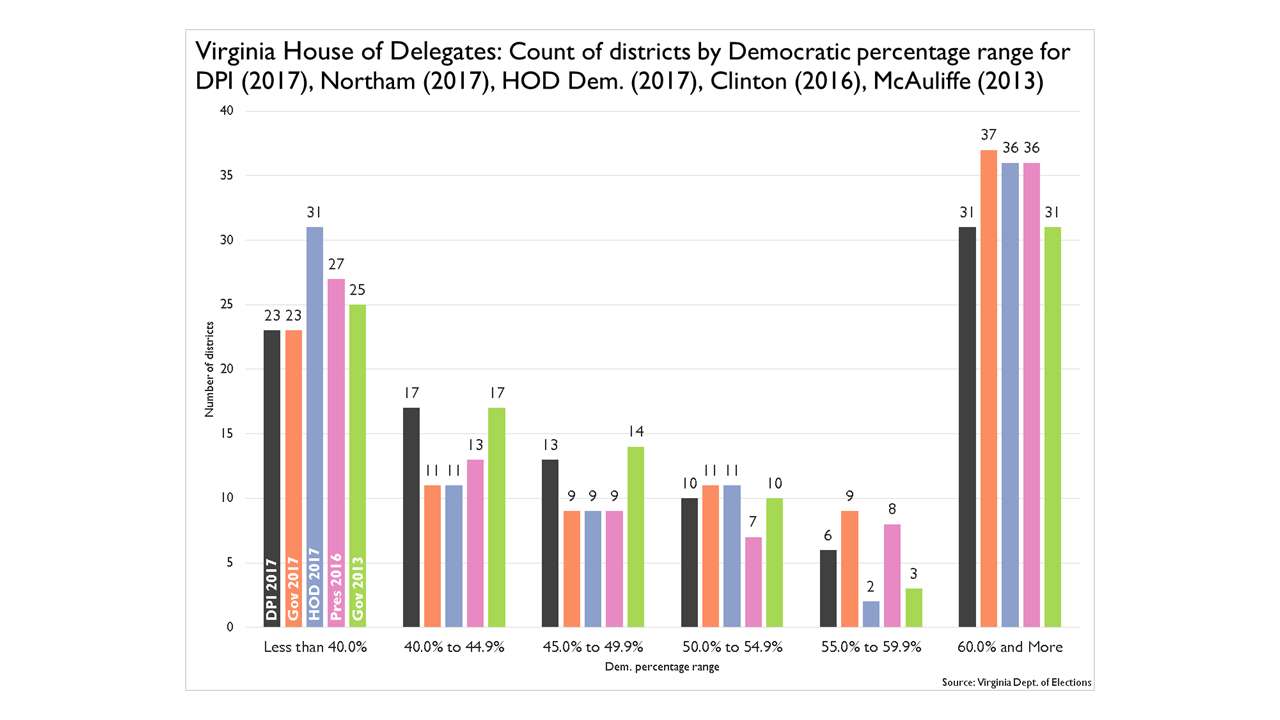
The figure above shows the number of House of Delegates districts that fall into several percentage ranges based on DPI and the results of recent elections. With so many districts in the 60-percent-plus range for Democratic percent, these counts show the effectiveness of the Republican gerrymander. They packed as many Democratic voters as possible into fewer than 40 districts, leaving just a handful of competitive districts. In 2013, shortly after the plan’s enactment, there were only an additional three districts where the result could be considered strongly Democratic. Contrast those totals with the more evenly distributed counts for Republican districts, and it becomes clear how much these districts favor the Republicans. Following the November 2017 election, with the Democratic caucus numbering at least 49 delegates, the results are more normalized to DPI.
It’s the Demographics
Both Clinton’s 2016 victory and, to a large extent Terry McAuliffe’s in 2013, were rooted in the demographic shift that has altered the state. Primarily focused in Northern Virginia and Richmond, the shift has transformed the suburbs. Less obvious, however, is the effect of changing demographics in Virginia Beach, Tidewater, and the Richmond exurbs. Rural areas, principally in the Roanoke-Lynchburg media market, were still solidly Republican, but elevated Democratic margins driven by growth in the state’s exurbs could not be matched by the Republicans there.
Overall, Democrats gained three Republican open seats (HD-02, HD-42 and HD-72) and ousted 12 Republican incumbents in November. The outcome in three additional districts remains in dispute, with margins of 0.4 points or less (HD-28, HD-40, HD-94).
Education Level as a Key Indicator for the Future
Apart from shifting demographics, the most powerful factor in the Democratic victories was educational attainment of voters in those districts. Statewide, in 2015 the higher education level in Virginia was 36.9 percent—exceeding the national average by 4.4 percentage points (link). All but 2 of the 15 flipped districts exceed the national average, with 13 of the 15 exceeding the Virginia average.
The Democratic victories were spread out geographically, delivering districts in Northern Virginia, the Richmond area, Tidewater and a rural southwestern district.
Five of the Democratic pickups were located in districts where a majority of the adult population holds a college degree or higher:
| Majority College Degrees Districts | |||||
| District | Higher Education Pct | 2017 House Dem | Clinton | McAuliffe | Area |
|---|---|---|---|---|---|
| HD-10 | 50.3% | 51.9% | 53.5% | 48.4% | NoVA Suburbs |
| HD-32 | 68.2% | 53.5% | 60.7% | 53.6% | NoVA Suburbs |
| HD-42 | 61.9% | 61.0% | 63.5% | 54.3% | NoVA Suburbs |
| HD-67 | 64.7% | 57.9% | 63.6% | 64.8% | NoVA Suburbs |
| HD-68 | 61.0% | 50.4% | 56.6% | 49.4% | Richmond Suburbs |
In 2016, Hillary Clinton won all five of these districts, although McAuliffe lost two of them in 2013. The victory margin in these five contests is noteworthy, as three of the Democratic pickups were carried by more than 17 points, showcasing the transparent correlation between Democratic success and high educational attainment.
Though it seems obvious now that districts 67 and 68 would be targets, neither district had a Democratic contender in 2015. The retirement of long-time moderate Republican Dave Albo left a clear path for Democrat Kathy Tran in District 42.
In a second tier of districts, with higher education levels between 40 and 50 percent, we find that the Democratic successes were achieved in three of four districts that lie outside the DC media market. These districts exemplify the broader developments in the state, as two of these districts were carried by Republican Ken Cuccinelli in 2013, but favored Clinton in 2016.
| Higher Education Levels 40% – 50% | |||||
| District | Higher Education Pct | 2017 House Dem | Clinton | McAuliffe | Area |
|---|---|---|---|---|---|
| HD-12 | 41.8% | 54.4% | 51.0% | 53.2% | Rural |
| HD-51 | 44.7% | 52.8% | 56.7% | 50.1% | NoVA Suburbs |
| HD-72 | 49.7% | 52.5% | 53.2% | 47.2% | Richmond Suburbs |
| HD-73 | 42.8% | 51.7% | 54.4% | 47.3% | Richmond Suburbs |
The next set of districts to examine are Democratic pick-ups with a proportion of bachelor’s degree holders above or near the state average (36.9%).
| Higher Education Levels Above the State Average | |||||
| District | Higher Education Pct | 2017 House Dem | Clinton | McAuliffe | Area |
|---|---|---|---|---|---|
| HD-02 | 37.0% | 62.7% | 60.6% | 55.9% | NoVA Exurbs |
| HD-13 | 36.6% | 54.2% | 56.6% | 49.8% | NoVA Exurbs |
| HD-31 | 39.1% | 54.6% | 55.1% | 50.9% | NoVA Outer Exurbs |
| HD-50 | 36.2% | 54.4% | 57.2% | 49.7% | NoVA Exurbs |
This cohort of districts is perhaps the most important going forward. These exurban areas, which lie outside of Eastern Loudoun County, are trending Democratic. If this continues, it’s catastrophic to Republican strategy in the state, as these areas are essential to any Republican statewide coalition. Manassas, Prince William, Fauquier and Stafford (from north to south) are areas that Republicans must win to offset the Democratic advantage in the Northern Virginia suburbs and the the heavily African American cities such as Hampton, Norfolk, Petersburg, and Richmond. Districts 31 and 50 in particular are bellwethers, often mirroring the statewide vote shares for each party.
| Virginia Beach Districts | |||||
| District | Higher Education Pct | 2017 House Dem | Clinton | McAuliffe | Area |
|---|---|---|---|---|---|
| HD-21 | 31.4% | 52.6% | 51.7% | 52.0% | VA Beach/Chesapeake |
| HD-85 | 29.9% | 50.8% | 49.5% | 48.9% | VA Beach |
Just as with the above districts, the Republican defeat in the Virginia Beach-Chesapeake area is an ominous sign for Republicans. Ralph Northam carried Virginia Beach overall, a fatal blow to Republican prospects statewide. These two Democratic pickups, in districts that voted far below the statewide levels for the Democrats in recent Presidential and Gubernatorial elections, demonstrate that the playing field is widening for Virginia Democrats.
The last cohort to highlight are the handful of districts where the Democrats came within a handful of votes of victory. In four of the five districts we’ve highlighted, the higher education level is at or below the statewide average. Even in these less-educated districts, the Democrats ran very competitive contests. Democrat Dante Fowler nearly unseated Tim Hugo in district 40, and his vote share relative to Barack Obama’s in 2012 (+8.2 points) suggests we could be seeing the end of support for Republicans in Fairfax County.
| Other Highly Competitve Districts | |||||
| District | Higher Education Pct | 2017 House Dem | Clinton | McAuliffe | Area |
|---|---|---|---|---|---|
| HD-27 | 37.7% | 49.8% | 48.9% | 45.6% | Richmond Suburbs |
| HD-28 | 35.9% | 49.8% | 49.4% | 47.0% | NoVA Exurbs |
| HD-40 | 61.3% | 49.8% | 57.3%% | 47.8% | NoVA Suburbs |
| HD-94 | 30.2% | 50.0% | 54.5% | 51.4% | Newport News |
| HD-100 | 20.2% | 47.7% | 51.4% | 51.5% | Rural |
District 28, the home of former House Speaker Bill Howell and far from the core Democratic areas of Northern Virginia, also appears increasingly marginal going forward.
It’s too soon to tell if the factors at play in 2017 will be present when voters go to the polls next year, but the emergence of educational attainment as a predictor of voter preference is a development that can’t be missed. Virginia is a state that has been trending Democratic for the past decade, and the state party did a fantastic job recruiting strong candidates and challenging Republicans everywhere. If there is a lesson to be learned there in 2017, it’s that following these demographic trends can help identify competitive targets.