Hillary Clinton has the won the popular vote by a larger margin than Al Gore in the 2000 election. When all votes are tallied, her margin of victory is likely to exceed 1.5 million. Still, she lost the electoral college, and hopefully put to rest the persistent notion that changing demographics among the electorate have afforded the Democrats a strong inherent advantage in electoral votes. It is true that the diversifying American population does create places of advantage for the Democrats, but as we have just seen, the rest of the electorate does not exist in a vacuum and its habits are changing along with the population.
Donald Trump has shown that for the time being, an elevated share of the white vote, particularly in the Industrial Midwest (Iowa, Michigan, Ohio, Wisconsin) can still produce enough support to elect a Republican nationally. The population is indeed becoming more diverse, but the decline in Democratic support among white voters without a college degree has potentially diluted the impact of that transition. States like Indiana—carried by Obama in 2008—and Missouri, which used to be competitive and are now solidly Republican, demonstrate this change in the electorate, which could have implications for years to come.
This article, however, is about the future, and is not intended to detail strategic mistakes of the 2016 Democratic campaign.
One method of predicting the outcome of future elections is to compare the trend in state results relative the national major-party margin of all states. The 2016 presidential election, where Clinton won the popular vote by about 1.1 percentage points is illustrative. We will also comment on the Obama coalition of states in 2008 and 2012.
We acknowledge that there are still millions of votes to be counted, especially in California, so these figures are important but may face future revision.
New Hampshire: In 2016, this state was once again one of the most competitive in the country. Clinton’s eventual margin in New Hampshire (0.4%) could approach 0.9 points below the national margin (1.08%). By contrast, President Obama exceeded the national margin by 2.3 points in 2008 (9.7% to 7.4%), and by 1.5 points in 2012 (5.66% to 3.92%). With only four electoral votes, New Hampshire is not as consequential as a few of the other states that made the difference this year.
Michigan: Michigan was the second closest state relative to the national margin. Clinton lost the state by 0.2 points. We estimate that her margin in Michigan will be approx. 1.5 points below the national level (1.5%) when all ballots are counted. Conversely, President Obama’s margin in Michigan exceeded the national margin by 5.7% in 2012 (9.6% to 3.9%). This results lends further credence to our contention that a turnout issue in Detroit, combined with a loss of support in blue collar counties like Macomb, damaged the Clinton campaign in the state.
Pennsylvania: We have long believed that Pennsylvania was trending Republican, despite the state’s record of leaning Democratic. Compared to the national difference, Obama ran only 1.5 points ahead in 2012 (5.4% to 3.9%), after running 3.1 points ahead in 2008 (10.5% to 7.4%). This year, Clinton will end up performing about 2.4 points below the national spread. Her loss of Pennsylvania’s 20 electoral votes was generated by a combination of poor turnout in Philadelphia and Pittsburgh, and the legion of blue collar counties north and west of Philadelphia—Bucks, Berks, Lackawanna, Lehigh, Luzerne, and Schuylkill are examples.
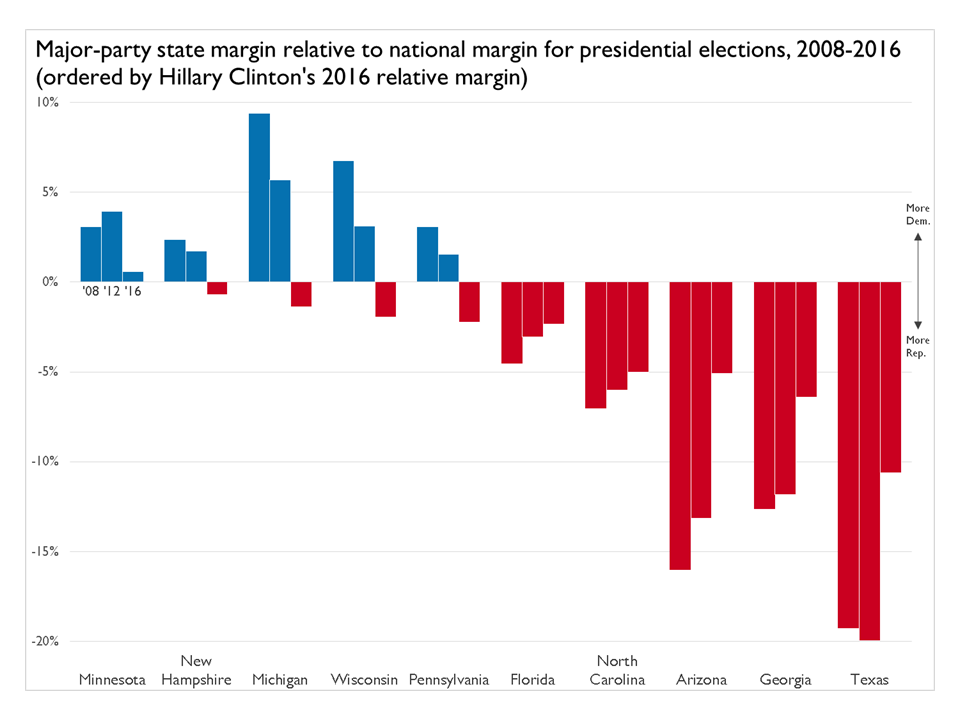
Wisconsin: Completing the trio of states that prevented the Democrats from retaining the White House was Wisconsin. In Milwaukee County alone, a decline of 72,285 (14.8%) in the major party vote doubtless hurt Clinton’s chance of winning the state. It was the first time since 1984 that a Republican carried Wisconsin. Clinton trailed her national margin by 2.2 points, after Obama ran 6.7 points stronger in 2008 (14.1% to 7.4%) and 3.1 points better in 2012 (7.0% to 3.9%).
Minnesota: The results in Minnesota are alarming, and we hope do not foreshadow potential Democratic electoral challenges in 2020. Although Clinton won the state, her major party percentage was only 50.8, besting Trump by 44,000 votes. Clinton performed only 0.2 points above the national norm. In both 2008 and 2012, Obama’s margin in the state exceeded the national norm, by 3.1 points in 2008 (10.5% to 7.4%) and 4.0 points in 2012 (7.9% to 3.9%).
North Carolina: Donald Trump’s 3.7 point victory margin is one of the more surprising results of this election. The combination of high education suburbs and urban voters in Charlotte, Durham and Raleigh, seemed to predict a toss up contest with a slight edge to Clinton. Obama won North Carolina in 2008 (0.3% margin) and narrowly lost in 2012 (-2.1% margin)–despite running 6.0 points below his national norm in the state. Unlike the midwestern states detailed above, we are more optimistic about North Carolina in future years. A high point for Democrats here this year is that subject to a recount, North Carolina may have elected a Democratic governor this year despite the loss at the top of the ticket.
Florida: As is always the case, political analysts remain focused on Florida, a state that Clinton lost by 1.2 points this year, or 2.5 points below the national margin. Although Obama won Florida in 2008 and 2012, the President’s margin in the last election was 3 points below the national norm. Clinton crushed Trump in Orlando and in Orange County, while also carrying former state bellwether Hillsborough County, but likely lost the state in rural and exurban areas.
There is more evidence that Georgia, Arizona and Texas are gaining momentum as competitive states. Racial diversity may allow these states to equal or surpass the Democratic presidential vote in midwestern states, particularly Iowa.
Georgia: Clinton lost the state by a competitive 5.2 points. Not only did her performance almost match the Obama percentage, but she performed 6.5 points below the national margin, cutting Obama’s normalized percentage (-12.6% in 2008 and -11.8% in 2012) almost in half. Future Georgia presidential elections will be highly competitive.
Arizona: A more dramatic change was discernible in Arizona. In losing the state by 3.6 points this year, Clinton performed within 4.9 points of her national norm. Obama, on the other hand, ran below his national margin by 16.0 points in 2008, and 13.2 points in 2008.
Texas: Although it may not happen until 2024, Texas is on the way toward marginal status, especially in presidential years. Clinton won 45.2 percent of the major-party vote, one of the few statewide Democratic candidates to exceed 45 percent in recent elections. Performing about 10 points below the national norm, Clinton performed almost 50 percent better than Obama’s margin relative to the norm in both 2008 (-19.2%) and 2012 (-19.9%). We expect the 2020 presidential nominee to win at least 47.5 percent of the major party vote in 2020.
Other Developments: Other states revealed surprising changes in this year’s election. Clinton narrowly carried Maine—1.4 points above the national norm—after successive presidential elections where the President exceeded the norm by 11.4 points in 2012 and 10.0 points in 2008, respectively. Virginia is another state with impressive results for Clinton. The state matched the national norm in 2012 and exceeded it by 4 points this year. The 2016 presidential election was the first time a Democrat exceeded the national norm in Virginia in a long time.
We will update this analysis when final numbers are in, and will further scrutinize the most efficient Democratic coalition of states for 2020.